
Most factories know what raw material and labor cost per unit. Few know what energy costs per unit. The electricity, natural gas and water bills arrive once a month as one number each, so nobody can say how much of it went into which product. This guide shows how to calculate energy cost per product and which data you need to collect first. The 90-second video below tells the same story.
The scenario in the video is a sample. All figures are illustrative.
The short answer
Energy cost per product is the energy used in a period, multiplied by its unit price, divided by the number of units produced in the same period. You need two logged series over the same time window: consumption from your meters and a production count. A data logger that writes both to a database with timestamps gives you that. A scheduled report then turns it into a number you can compare with your selling price.
Why the monthly bill is not enough
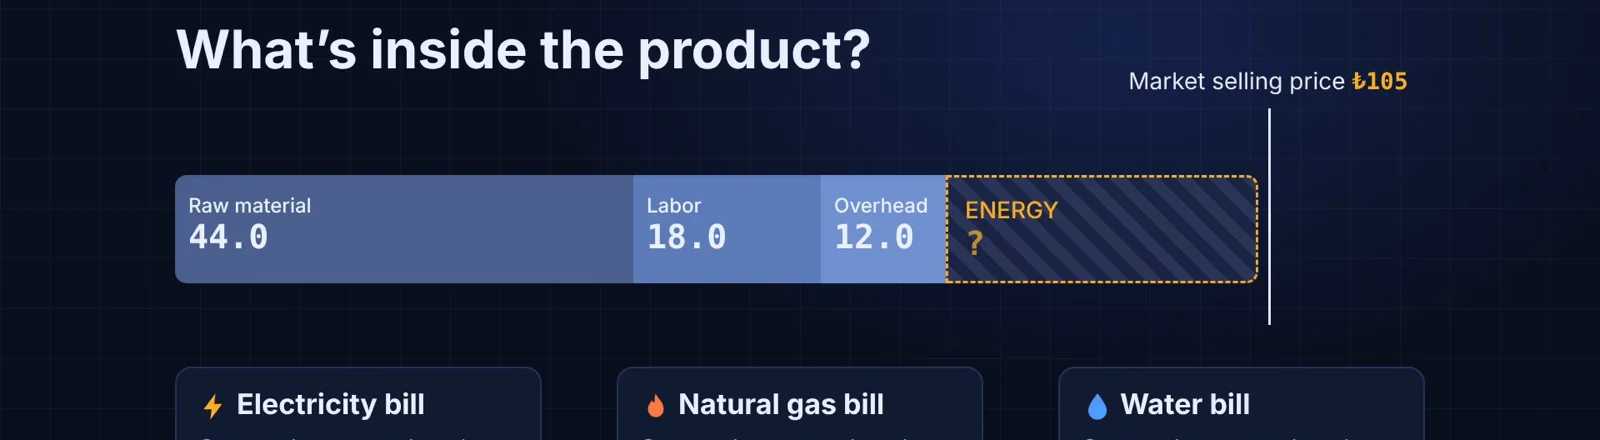
In the video, a manufacturer sells at the market price of 105. Raw material costs 44.0, labor 18.0 and overhead 12.0, which adds up to 74.0 per unit. That leaves 31.0 for everything else, energy included, before the sale stops making money. The market sets the price, so the only number the manufacturer can still influence is the cost. Energy is the one line nobody has measured.
A monthly bill gives you a total. It does not tell you which product, shift or line used the energy. Two products can run on the same line with very different consumption, and the bill averages them into one figure.
The four steps
1. Measure
Energy analyzers, water meters and gas meters tell you what each part of the plant uses. Decide the level you want to cost: the whole plant, a production line or a single machine. The finer the level, the better you can assign energy to a product.
2. Log
Meters and PLCs usually publish their values through an OPC UA server. A data logger connects to that server, reads the tags you choose and stores each value with a timestamp. RBS Report does this: it collects data from your OPC UA servers and logs it to SQL Server. Our guide What Is an OPC UA Data Logger and How Does It Work? explains the idea, and How to Log OPC UA Data to SQL Server walks through the setup.
Log a production count next to the meters. If your PLC exposes a counter of finished units, or a product code for the current order, add those tags to the same logger. Without a production figure you can only measure how much energy was used, not how much each unit cost.
3. Cost
Once the rows are in SQL Server, the calculation is a query over a period. This example assumes a table with one timestamp column and two cumulative counters that do not reset during the period. The table and column names are placeholders, so use your own.
SELECT CAST(LogTime AS date) AS Day,
       MAX(Energy_kWh)     - MIN(Energy_kWh)     AS kWh_used,
       MAX(Units_Produced) - MIN(Units_Produced) AS units
FROM   dbo.LineData
WHERE  LogTime >= '2026-11-01' AND LogTime < '2026-12-01'
GROUP  BY CAST(LogTime AS date);
Multiply kWh_used by your tariff and divide by units. With made-up numbers: 2,400 kWh at a tariff of 4.0 per kWh is 9,600, and 800 units produced on that day gives an energy cost of 12.0 per unit. Do the same for gas and water and add the three together.
Two points keep the result honest. Tariffs often change by time of day, so apply the right price to each interval and not one average to the whole month. And when several products share a line, split the energy by the product code or production order that was logged for each interval.
4. Price
With an energy cost per unit, your cost stack is complete: raw material, labor, overhead and energy. The sum is your floor price. When a customer or a competitor pushes the price down, you know exactly how far you can go before you lose money on the sale, and you can negotiate with that number in hand.
Where RBS Report fits
RBS Report collects data from OPC UA servers and logs it to SQL Server. It then builds Excel reports from the logged rows, using your own Excel templates, and can send them by email on a schedule, so the energy cost per product reaches the people who set prices without anyone running a query. It runs on Windows or in the cloud. See How to Send Scheduled Excel Reports from SQL Server by Email and How to Create an Excel Report from SQL Server Data for the reporting side.
Frequently asked questions
How do you calculate energy cost per product?
Divide the cost of the energy used in a period by the number of units produced in the same period. Calculate electricity, natural gas and water separately, then add them.
What data do I need to calculate it?
Consumption readings from your energy, gas and water meters, the tariff for each, and a production count or product code, all with timestamps so the series line up.
Why is the monthly utility bill not enough?
It gives one total per utility. It cannot show which product, line or shift used the energy, so it cannot give a cost per unit.
Do I need OPC UA to log meter data?
Not necessarily, but many meters, PLCs and gateways publish their values through an OPC UA server, and a data logger can read them from there and store them with a timestamp.
Where does RBS Report store the data?
In SQL Server. RBS Report can then build Excel reports from the logged rows and send them by email on a schedule.