

This walkthrough follows a demo we ran on one Windows PC. Three OPC UA tags go into a SQL Server table through RBS Data Logger, and the same rows then become an Excel report. The OPC UA server was a test server on the same PC, so every value here is a simulated demo signal: MotorSpeed around 1,480 rpm, BearingTemperature rising slowly from about 58 °C, and Power around 18.5 kW. "In our demo" marks what we actually saw.
1. Prepare the Windows setup
You need a Windows PC with RBS Report installed, a SQL Server instance with a database to log into, and an OPC UA server that publishes your tags. In our demo that was Windows 10 Pro 22H2 (x64) with .NET Framework 4.8, a local SQL Server Express instance (.\SQLEXPRESS) using Windows authentication, and the test OPC UA server on localhost.
Open Settings & Tools in the Configuration program. The first-time setup panel lists three things to finish once: the message queue (MSMQ) for the SQL writer, the SQL Server and database, and at least one OPC connection. In our Windows demo setup the message queue was already marked done. If yours is not, finish that first.
Under Database (SQL Server), enter the SQL Server name and the database name, pick the authentication type, then select Test connection and Save.
If it worked, a green message says the SQL Server setting was saved and the connection works. In our demo the SQL Server item in the first-time setup panel then showed done, and only the OPC connection was left.
2. Connect RBS Data Logger to the OPC UA endpoint
Open OPC Connections and add a connection. This is what we entered in the "Add an OPC connection" form:
| Field | In our demo |
|---|---|
| Protocol | OPC UA |
| Display name | Line 1 OPC UA |
| Connection id | line1 |
| Endpoint URL | opc.tcp://localhost:48410/rbsdemo |
| Security policy / Security mode | None / None |
The connection id accepts letters, digits, _ and - (1 to 32 characters). It is saved with every tag and cannot be changed later, so pick it with care. The display name can be renamed.
Select Discover endpoints if you want to see what the server offers. The form has no default for security policy or mode, so you have to choose them. We chose None for both because our test server ran on the same PC and was reachable from localhost only. That is a demo-only setting for an isolated test. For a real server, use what your server and your site require; this guide does not cover those settings.
After Add connection, "Line 1 OPC UA" should appear in the OPC Connections list.
3. Map the tags to SQL Server columns
Open SQL Tables and choose or create the table. Ours is OPCUA_Demo_Line1. On the left is the OPC browser:
- Connect with the OPC connection from step 2.
- Under Pick tags, expand the
Line1node and tickMotorSpeed,BearingTemperatureandPower. - Select Add checked tags as new columns.
- Select Save changes.
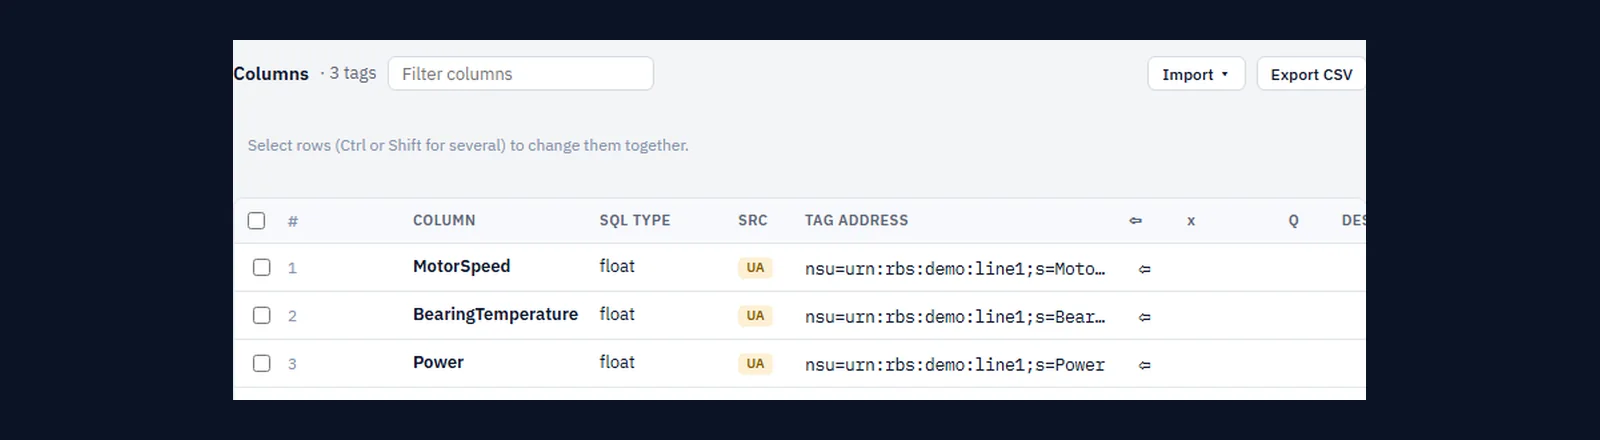
You should see a Columns list with three tags, each with a column name, an SQL type and an OPC UA node address. In our demo float was the SQL type for all three tags, and the address of Power was nsu=urn:rbs:demo:line1;s=Power. Before you save, the page says the tags were added to the new table as a draft and that nothing exists in SQL yet. That is expected.
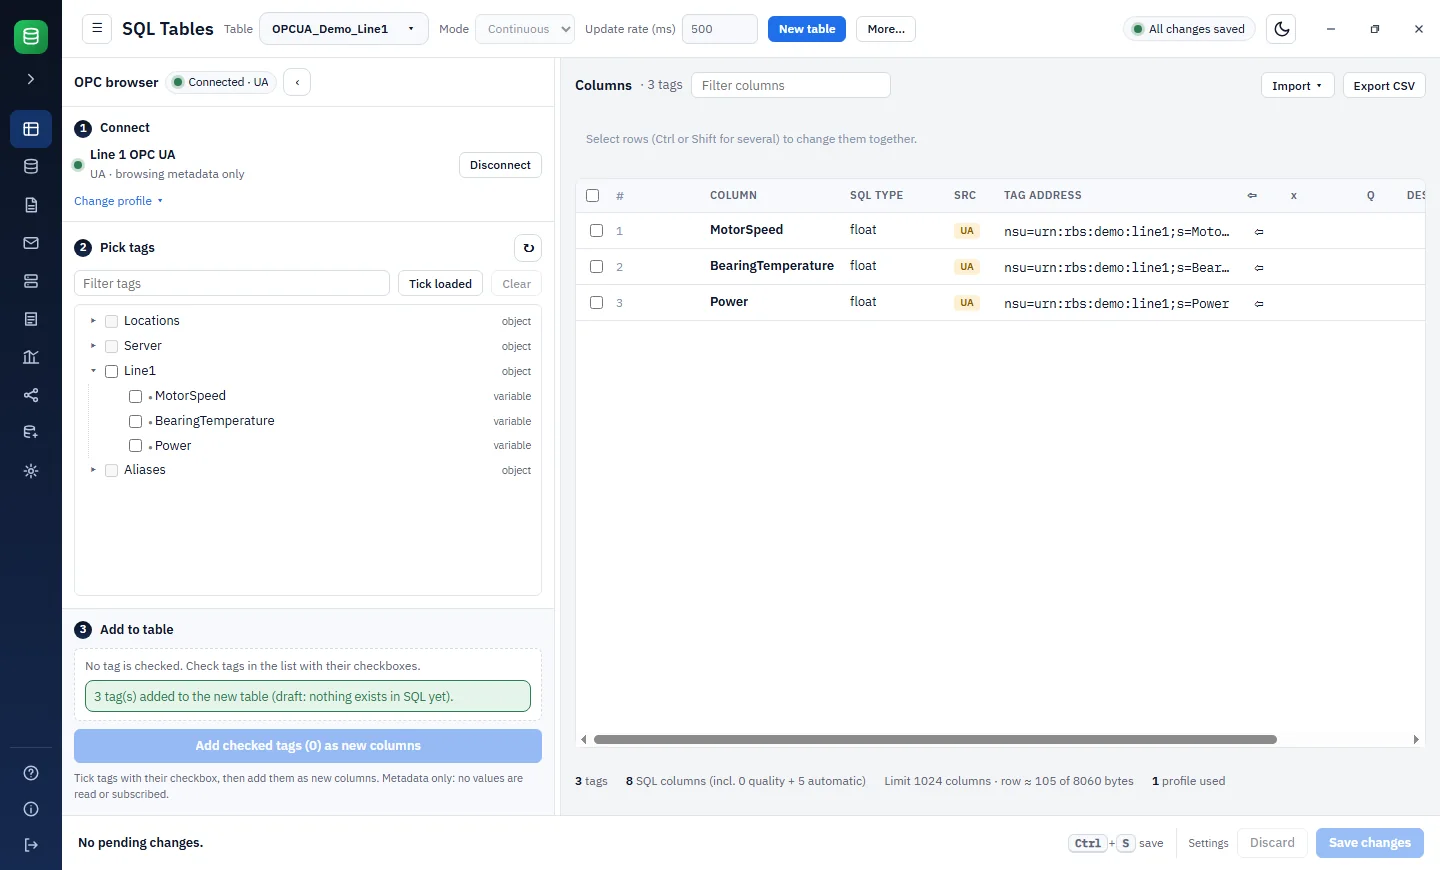
Once saved, the table in SQL Server had these columns: ID (int), MotorSpeed, BearingTemperature and Power (float), RealDate and OPCTimeStamp (datetime), and two text columns, Part1RealDate and Part2RealDate.
4. Start logging and check the rows
Open Data Logger Management. We kept the default work mode, the desktop application, and selected Start Desktop DataLogger. Only one mode collects data at a time, either the desktop application or the Windows service, so do not run both.
The page should report that the data collection engine is READY and show the time of the last successful SQL write. In our demo that read "1 s ago".
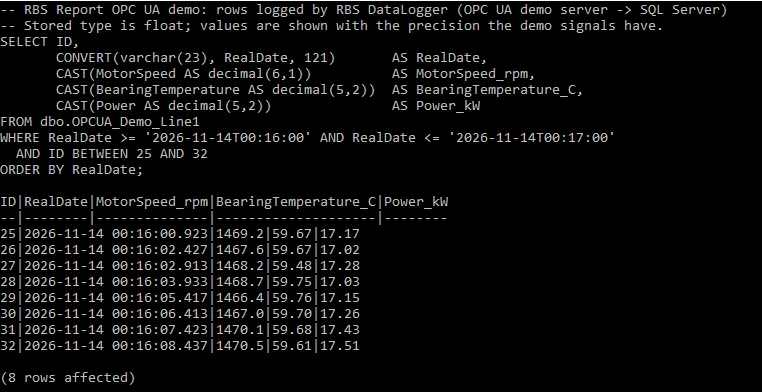
Now query the table with sqlcmd (which is what we used) or any SQL client:
SELECT ID,
       CONVERT(varchar(23), RealDate, 121)       AS RealDate,
       CAST(MotorSpeed AS decimal(6,1))          AS MotorSpeed_rpm,
       CAST(BearingTemperature AS decimal(5,2))  AS BearingTemperature_C,
       CAST(Power AS decimal(5,2))               AS Power_kW
FROM dbo.OPCUA_Demo_Line1
WHERE RealDate >= '2026-11-14T00:16:00' AND RealDate <= '2026-11-14T00:17:00'
  AND ID BETWEEN 25 AND 32
ORDER BY RealDate;
Change the RealDate window and the ID range to match your own rows. The CAST calls only tidy the output. The columns are float, and without the casts a value prints like 59.670000000000002. RealDate is the PC's local time (UTC+01:00 in our demo). OPCTimeStamp is UTC, so it is one hour earlier.
The query should return the rows logged in your window. In our demo it returned eight rows (IDs 25 to 32). These are the first four, exported to CSV:
ID,RealDate,MotorSpeed_rpm,BearingTemperature_C,Power_kW
25,2026-11-14 00:16:00.923,1469.2,59.67,17.17
26,2026-11-14 00:16:02.427,1467.6,59.67,17.02
27,2026-11-14 00:16:02.913,1468.2,59.48,17.28
28,2026-11-14 00:16:03.933,1468.7,59.75,17.03
5. Generate an Excel report from the same rows
Reports are defined on the Excel Reports page of the Configuration program. You need an Excel template. Ours was an empty workbook with the column widths set and the first row in bold. RBS Report wrote the headings and the values.
- Pick a folder, a report name and the Excel template.
- Under Data source, choose the connection, the database and the table (
dbo.OPCUA_Demo_Line1). - Add the cells. In our demo the headings went in row 1 as "Text or formula" cells: "Motor speed (rpm)", "Bearing temperature (degC)", "Power (kW)" and "Timestamp". The SQL columns
MotorSpeed,BearingTemperature,PowerandRealDatewent in row 2 as "Table column" cells. - Select Save report.
Then open Reports in ExcelTrend and select the report. Set the conditions to the same rows you checked in step 4. We used RealDate between 00:16 and 00:17 and ID between 25 and 32. Select Preview, then export with Excel, PDF or CSV.
In our demo the preview showed the same eight rows ("8 rows · 2 conditions") and the export held the same eight samples.
Figure 3 is a PDF export of the Excel report, shown as an image. It is not a screenshot of Excel.
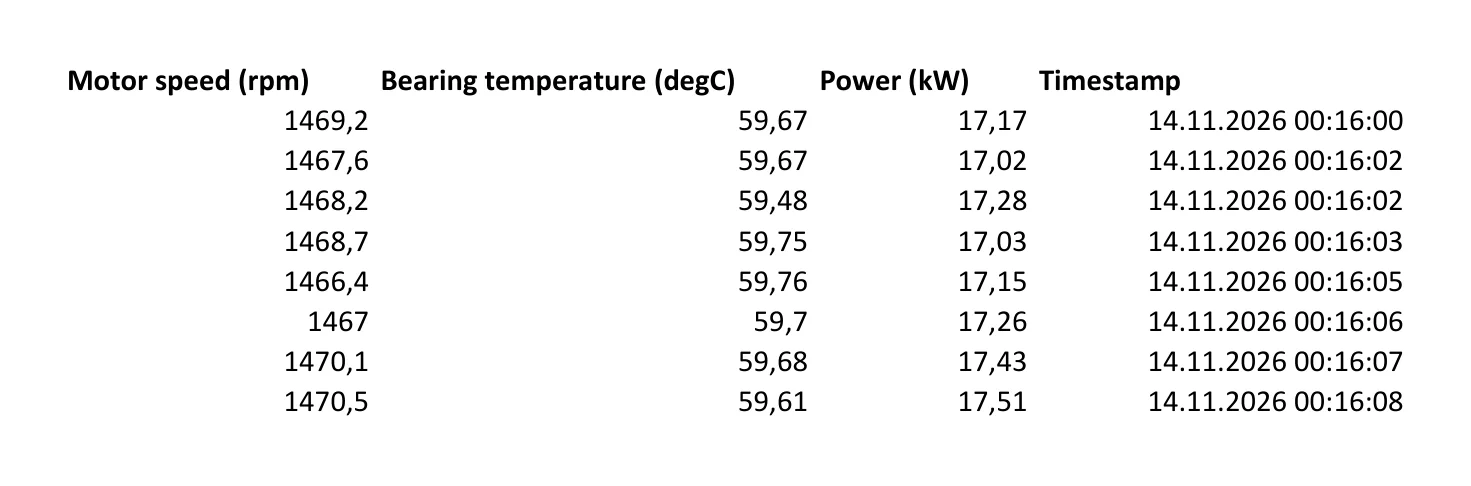
Two things differ from the SQL result. The report writes the timestamp to the second, without milliseconds. The PDF also follows the regional format of the PC that made it, and ours used a Dutch locale, so the decimal separator is a comma (1469,2 instead of 1469.2).
To try this with your own server and database, start from the OPC UA Data Logger page, which also has the demo request.