
This guide turns the rows of a SQL Server table into an Excel report with RBS ExcelTrend. You define the report once from your own Excel template. After that, each report is a time window and an export. The example uses the demo table from our guide on logging OPC UA data to SQL Server: three simulated signals, MotorSpeed, BearingTemperature and Power, in the table dbo.OPCUA_Demo_Line1. For this guide the report reads a copy of that table, with 1,598 rows, in a database called RbsDemoLine1. "In our demo" marks what we saw on screen.
What you need
ExcelTrend is the reporting application of RBS Report for Windows. It reads rows that RBS Data Logger has stored in SQL Server, so the table you report on has to be filled by the logger. You also need an Excel template for the report.
1. Prepare the Excel template
The template can be simple. Ours, Line1_Shift_Template.xlsx, is an empty workbook with the column widths set and the first row in bold. RBS Report writes the headings and the values into it.
2. Define the report
Reports are defined on the Excel Reports page of the Configuration program.
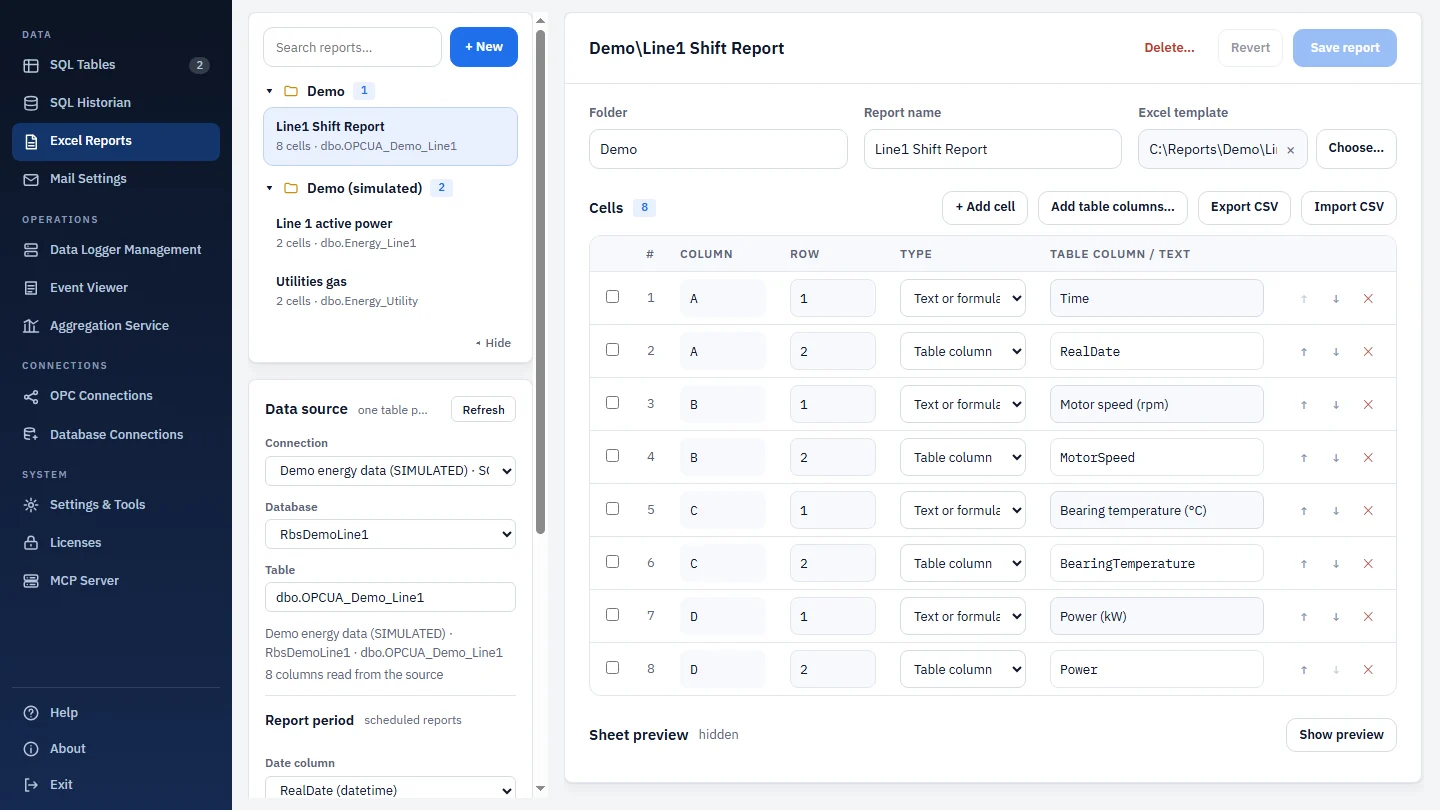
- Pick a folder, a report name and the Excel template. In our demo the folder is "Demo" and the report is "Line1 Shift Report".
- Under Data source, choose the connection, the database and the table. We used the connection "Demo energy data (SIMULATED)", the database
RbsDemoLine1and the tabledbo.OPCUA_Demo_Line1. The page confirms how many columns it reads from the source: 8 in our demo. - Add the cells. We used two kinds. A "Text or formula" cell holds a heading, and a "Table column" cell takes its value from a SQL column. In our demo the headings went in row 1: "Time", "Motor speed (rpm)", "Bearing temperature (°C)" and "Power (kW)". The columns
RealDate,MotorSpeed,BearingTemperatureandPowerwent in row 2 as "Table column" cells. - Select Save report.
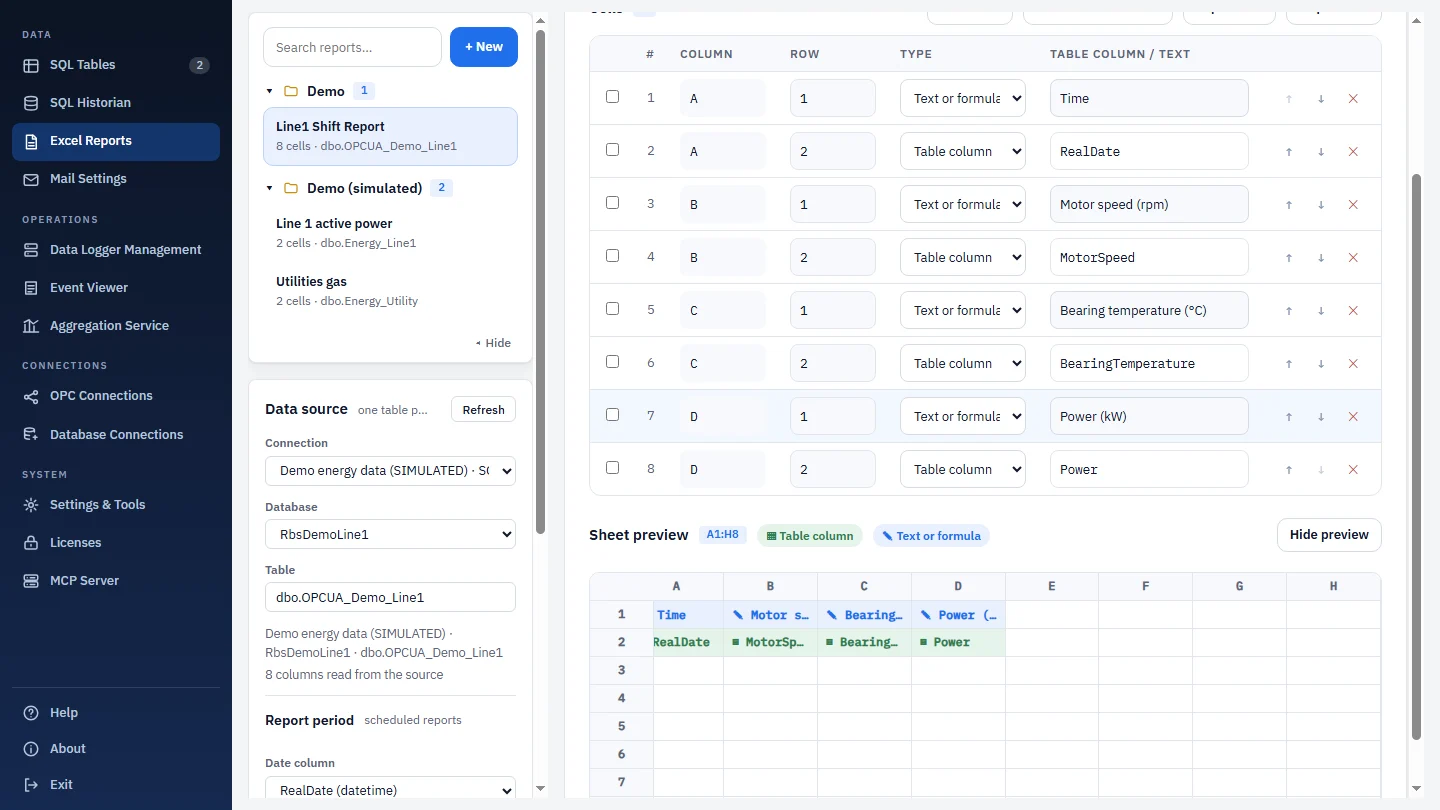
Under Sheet preview, select Show preview to see the cells on a sheet grid before you save. In our demo the four headings sat in row 1 and the four columns in row 2.
3. Select the rows and check the preview
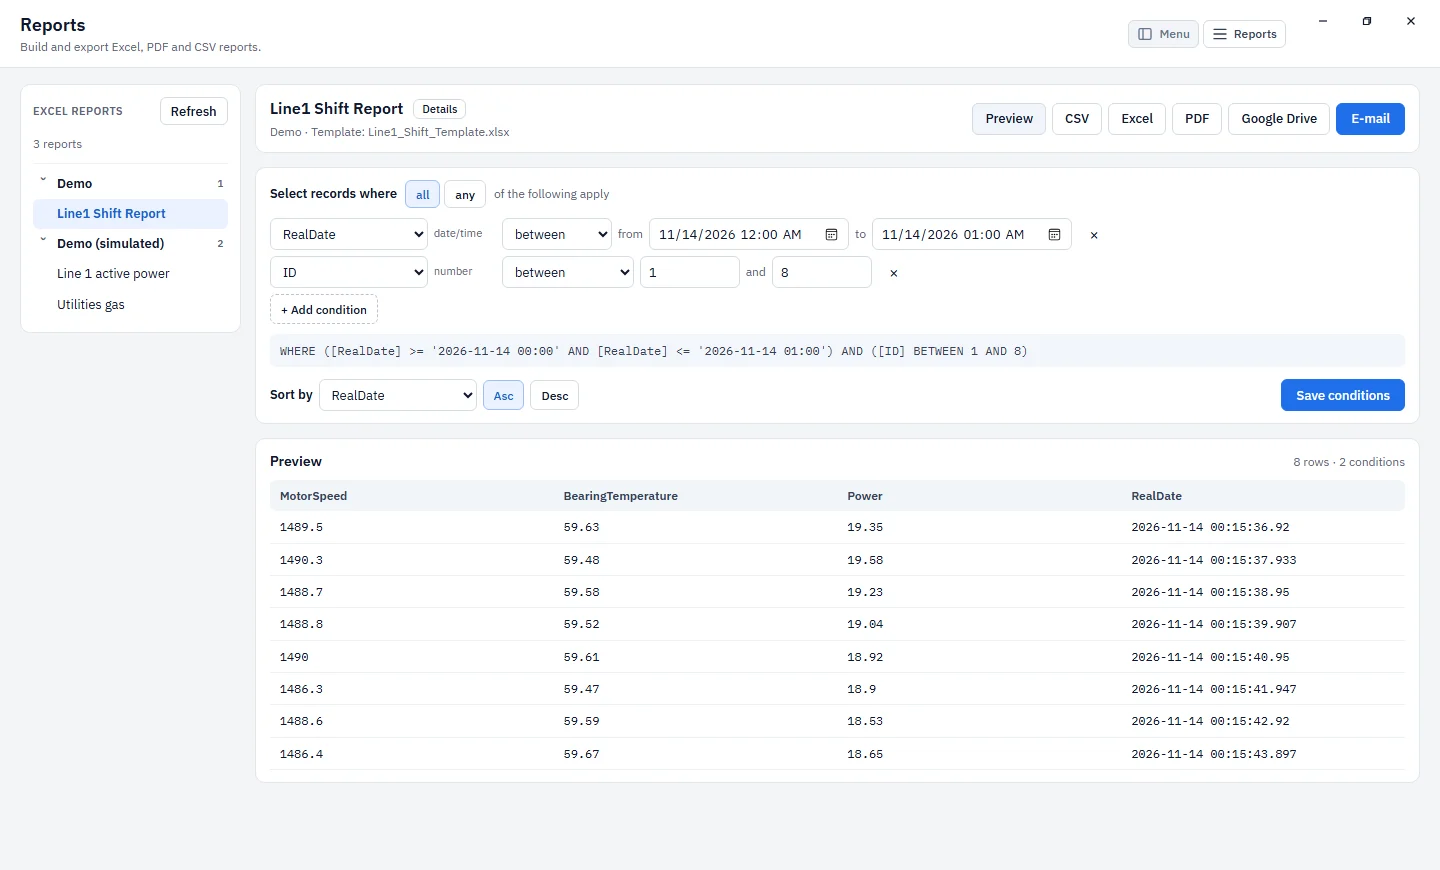
Open Reports in ExcelTrend and select the report. Then set the conditions that pick the rows. You can filter by a time window or by other columns, and ExcelTrend shows the resulting WHERE clause under the conditions. In our demo we used RealDate between 11/14/2026 12:00 AM and 01:00 AM, and ID between 1 and 8.
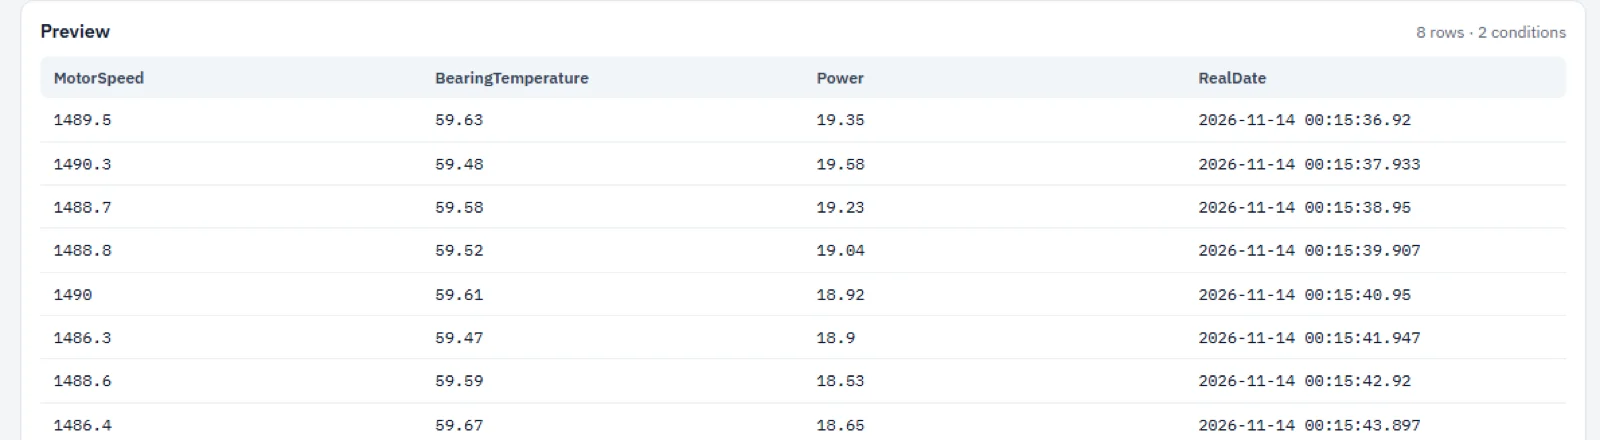
Select Preview before you export. In our demo the preview showed "8 rows · 2 conditions" with the columns MotorSpeed, BearingTemperature, Power and RealDate. If the count is wrong, change the conditions and preview again.
4. Export the report
The buttons above the conditions export the report. One report definition exports to Excel, PDF or CSV, so you choose the format when you export. In our demo the exported workbook held a header row and the eight data rows.
Two details in the output
The report writes the timestamp to the second, without milliseconds, while the SQL column keeps them. The PDF also follows the regional format of the PC that creates it. On our PC, which uses a Dutch locale, the decimal separator in the PDF is a comma instead of a point.
Scheduled reports
This guide covers a report you run and export by hand. RBS Report can also generate such a report on a schedule and send it by email; our guide on sending scheduled Excel reports from SQL Server by email walks through that setup. To see the whole workflow with your own data, start from the OPC UA Data Logger page, which also has the demo request.